The Silent Killer in Your Quarkus App: A Guide to Hunting Down Event Loop Blockers
You’ve been there. Your new Quarkus Reactive service is a beast on your 16-core MacBook Pro. Endpoints are snappy, tests fly, and you’re feeling pretty good. You ship it to your Kubernetes cluster, give it a modest 500m CPU, and walk away. A few hours later, the alerts start firing. Latency is through the roof, pods are restarting, and users are complaining. What went wrong? The code that was lightning-fast locally is now crawling in production. Welcome to the subtle, dangerous world of blocking the event loop.
The Crime Scene: A Tale of Two Environments
To understand the problem, you need to understand the core of Quarkus Reactive: the Vert.x event loop. Think of an event loop thread as a single, hyper-efficient worker at a dispatch center. This worker is incredibly fast at handling small, non-blocking tasks: receiving a network request, firing off a database query, writing a response, and immediately moving to the next task. It never waits. As long as every task is quick, this single worker can handle thousands of operations per second.
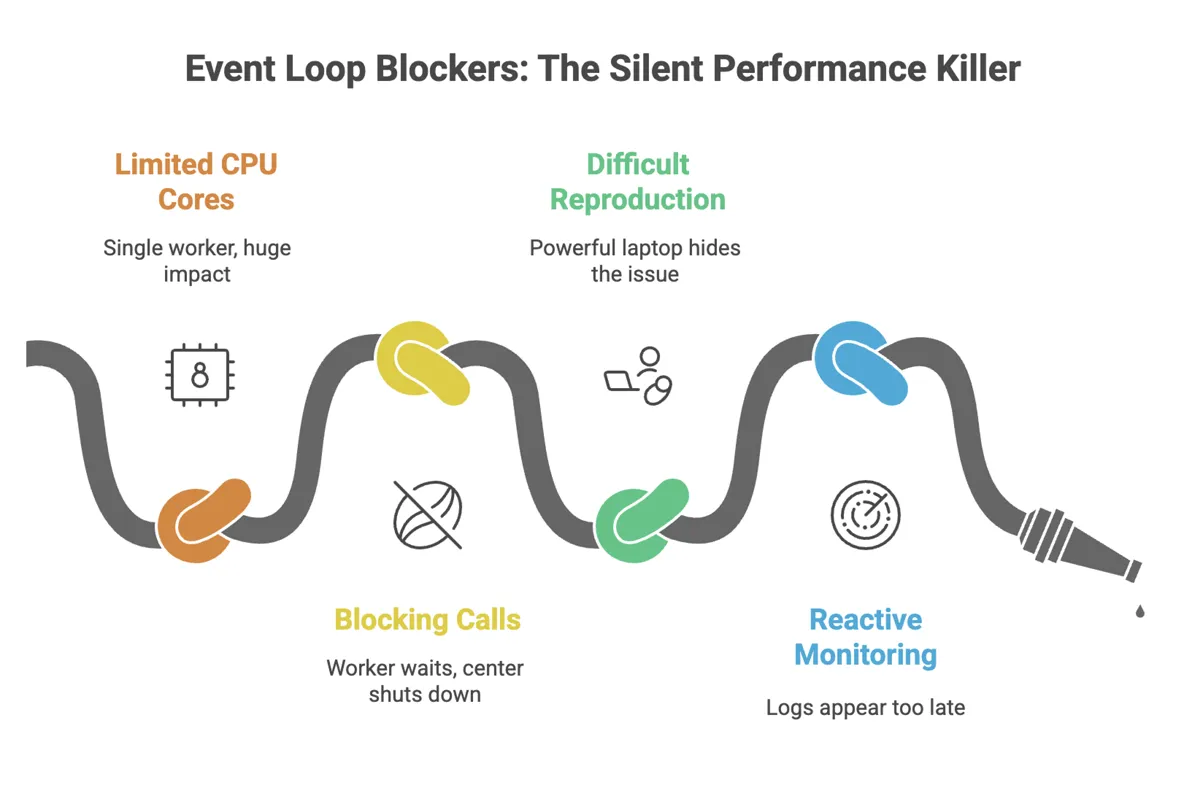
Now, here's the catch: Quarkus decides how many of these 'workers' to create based on the number of CPU cores it sees. Your MacBook has many cores, so you get a whole team of these workers. A blocking call (like a traditional JDBC query or reading a large file) is like telling one of these workers to go get coffee and wait in line for 200ms. On your laptop, another worker just picks up the slack. No big deal.
But in your Kubernetes pod with cpu: 0.5, the JVM might only see one core. You have just one worker. When you tell that single worker to go wait for coffee, the entire dispatch center shuts down. No new requests are handled. No Kafka messages are processed. No scheduled jobs run. This is the cascade effect: a single blocked thread freezes a significant portion of your application, causing latency spikes and timeouts across completely unrelated features.
The Interrogation: Forcing a Confession on Your Local Machine
You can't fix a bug you can't reproduce. To catch our villain, we need to make your powerful laptop behave like a weak production pod. The secret is to lie to the JVM about how many cores it has.
Start your Quarkus app with this JVM option. This tells it to act as if it only has a single CPU core:
mvn quarkus:dev -Djvm.args=-XX:ActiveProcessorCount=1Now, let's create a deliberately 'guilty' endpoint. This code looks innocent, but the Thread.sleep() is our stand-in for any blocking operation—a slow JDBC call, a synchronous HTTP client, or complex file I/O.
@Path(/block)
public class BlockingResource {
  @GET
  public String blockTheLoop() {
    try {
      // This simulates a blocking database call or legacy API
      Thread.sleep(250);
    } catch (InterruptedException ignored) {}
    return This response was delayed!;
  }
}
Hammer this endpoint with a simple load tool like wrk (wrk -c50 -t4 -d30s http://localhost:8080/block). Now, watch your console. You're about to see the smoking gun.
The Evidence: Logs and Metrics Don't Lie
When you block the event loop, Vert.x will scream at you. You'll see a log message that is impossible to ignore:
WARN [io.vertx.core.impl.BlockedThreadChecker] (vertx-blocked-thread-checker) Thread Thread[vert.x-eventloop-thread-0,5,main] has been blocked for 253 ms, time limit is 100 ms
This is your confession. But waiting for logs in production is too late. We need proactive monitoring. Add these to your application.properties to set up your surveillance kit:
# Tell Vert.x the maximum time a task should run on the event loop
quarkus.vertx.max-event-loop-execute-time=100ms

# Enable Micrometer to export metrics to Prometheus
quarkus.micrometer.enabled=true
quarkus.micrometer.export.prometheus.enabled=true
quarkus.micrometer.binder.vertx.enabled=true
Now, you can build a dashboard that tracks the real story: p99 latency (the experience of your unluckiest users), Kubernetes CPU Throttling (your pod gasping for air), and Kafka Consumer Lag (the traffic jam spreading through your system).
The Arsenal: Choosing the Right Tool for the Job
Okay, we've found the problem. How do we fix it? You have several excellent tools in the Quarkus ecosystem, each suited for a different situation.
1. @Blocking
This is the simplest and safest fix. You're telling Quarkus, "I know this method is slow. Please run it on a different 'worker' thread pool and don't let it touch my precious event loop." It's a one-line change that solves the immediate problem. Sometimes it also cannot work because of reactive drivers, where db sessions live in event loop.
import io.smallrye.common.annotation.Blocking;

@GET
@Path(/report)
@Blocking // Problem solved.
public String generateReport() {
  // Your slow, blocking JDBC/file I/O code is now safe here.
  return reportService.generate();
}
2. @RunOnVirtualThread (JDK 21+)
If you're on Java 21+, this is often even better than @Blocking for I/O-bound work. Virtual Threads are lightweight threads that don't tie up a real OS thread while waiting for I/O. It gives you the performance of non-blocking code with the simplicity of writing traditional, blocking code. It's the best of both worlds.
import io.smallrye.common.annotation.RunOnVirtualThread;

@GET
@Path(/invoice)
@RunOnVirtualThread // Let the JVM handle the magic.
public String fetchInvoice() {
  // Call that legacy SOAP service without fear.
  return legacyClient.getInvoice();
}
3. runSubscriptionOn
Sometimes, your whole method isn't blocking, just one small part of a reactive pipeline. In this case, you can use Mutiny to offload just that specific piece of work to a worker pool. It's more precise.
import io.smallrye.mutiny.Uni;
import io.smallrye.mutiny.infrastructure.Infrastructure;

public Uni<String> processData() {
  return Uni.createFrom().item(() -> someFastReactiveCall())
    .onItem().transformToUni(fastResult ->
      // This is the only blocking part!
      Uni.createFrom().item(() -> callLegacySystem(fastResult))
         .runSubscriptionOn(Infrastructure.getDefaultExecutor()) // Offload it!
    );
}
4. Fully Reactive Clients
The ultimate solution is to embrace the reactive model fully. Instead of offloading blocking calls, you replace them. Use Hibernate Reactive instead of JDBC. Use the Quarkus Reactive Web Client instead of a synchronous one. This approach requires more code changes but results in the most efficient application, as you never leave the event loop at all.
Blocking the event loop is a rookie mistake we all make, but it has expert-level consequences. By understanding the 'why' and learning the patterns to detect and fix it, you can build truly resilient, high-performance services.
- Always test with constrained CPU. Make
-XX:ActiveProcessorCount=1or reduce vertx warning time from default 2second to 500ms - Trust your logs. A Vert.x blocked thread warning is never a false positive. It's a bug
- Start with the simplest fix.
@Blockingor@RunOnVirtualThreadwill solve 90% of your problems with minimal effort - Monitor what matters. Alert on p99 latency and CPU throttling, not just CPU usage